
Why I Wrote This
Have you ever wanted to create stunning charts without having to learn the intricacies of D3 and SVG graphics in HTML? After watching endless hours of D3 videos and reading multiple blog posts, documentation, and books with nothing to show but a headache and a blank web page I decided to try to find something encapsulate D3's internals. I wanted something that could easily create Angular directives for each graph/chart I wanted to display on my site. In the search for the right library/package I came across some popular frameworks created by some smart people. For example, NVD3, C3, DashingD3, Angular-charts, and much more. There is no shortage of people who have created a framework for drawing D3 graphs in Angular directives, but there are a few conditions that must be met for my use case to apply to a particular library.
- Must be easy to understand what is needed for interface
- Documentation must be at least OK
- D3 code should allow for easy extension of framework
- Allow for stacked charts given a series of data
- Graphs that look good and function well
With the checklist in place I chose the framework line-chart made by n3-charts. I first started with just using bower to install n3-charts, however, I soon realized it didnt have all the customization in its Angular directive, and it was written in coffee script. This lead me to fork the repo and just grap the compiled Javascript file to work with. The project is now called ng3-charts and has a couple more features to have it meet my conditions, such as transitions with easing, font choices, range area chart type, and more.
The source code is found here, and it is available up in bower registry bower.io under ng3-charts, that is of course if you are using bower.
Creating Charts
Use Directives to Create Charts
I used directives of the directives to keep my charts scopes separate. I suggest this because 1. you only have to code it once and use it anywhere on your site and 2. you can have many different graphs on one page, so having it in its own isolate scope allows you to define different options for different graphs.
Data Structure
The most significant part of creating your charts/graphs is knowing your how the framework expects your data to be organized before feeding it into its interface. The structure is pretty easy to follow. Below is an example of the structure:
$scope.data = [
  {x: 0, value: 4, otherValue: 14},
  {x: 1, value: 8, otherValue: 1},
  {x: 2, value: 15, otherValue: 11},
  {x: 3, value: 16, otherValue: 147},
  {x: 4, value: 23, otherValue: 87},
  {x: 5, value: 42, otherValue: 45}
];
So now for some explaining. The JSON structure {x: 0, value: 4, otherValue: 14} defines one column of data that resides on the X axis (x:0 = first X position on the horizontal axis). The rest of the structure is just your data at the given x axis. For example, value:4 is your data point for how high you want your type of graph to be drawn at on the y axis. Really, any values that come after the x:0 property are Y axis data points for different graphs. So otherValue: 14 is just another graphs Y axis data point. You can list as many values after the first x axis point, but just be weary as too many will cause your data to become unreadable because of all the different graphs that will be drawn on one set of axes.
Options
ng3-charts comes with a bunch of options you can use for drawing and customizing your graph. For example, the stacks option allows you to define which data points on the X axis you want to stack on top of each other creating a stacked chart. Depending on which type of chart/graph you want to make (range, area, bar, line, stacked bar, or stacked area) depends on how you define your options. For example ...
$scope.options = {
  axes: {
    x: {key: 'x', labelFunction: function(value) {return value;}, type: 'linear', min: 0, max: 10, ticks: 2},
    y: {type: 'linear', min: 0, max: 1, ticks: 5},
    y2: {type: 'linear', min: 0, max: 1, ticks: [1, 2, 3, 4]}
  },
  series: [
    {y: 'value', color: 'steelblue', thickness: '2px', type: 'area', striped: true, label: 'Pouet'},
    {y: 'otherValue', axis: 'y2', color: 'lightsteelblue', visible: false, drawDots: true, dotSize: 2}
  ],
  lineMode: 'linear',
  transition: {ease: 'elastic', duration: 1000, delay: 50},
  tension: 0.7,
  tooltip: {mode: 'scrubber', formatter: function(x, y, series) {return 'pouet';}},
  drawLegend: true,
  drawDots: true,
  columnsHGap: 5
}
The above snippet was taken directly from the README file on the github site page. Actually, thats pretty much the best place to look if you get hung up with ng3-charts, as the documentation is thorough, but for now I will go over some key options and their limitations.
Axes
This corresponds to the X and Y axes. Now there is only one X axis which is the horizontal axis along the bottom of the chart, on the other hand, there are two Y axes. Y1 corresponds to the left Y axis, and Y2 corresponds to the right Y axis. If you are familiar D3 the type property of the axis dictate which scaling function is used. Currently ng3-charts only supports date and linear scales where linear scales are the most commonly used scaling function.
Creating ng3-charts Inside Angular Directives
Onto the fun stuff now. We learned how to draw ng3-charts via the README on the github page, however, now we want to actually create reusable and maintainable charts using Angular's most powerful feature "The Directive". I encapsulate the logic of each individual chart in a directive because it allows for resuse across my application and allows for multiple $scope.options which means more than one graph in a single controller. For example, say my main welcome page for my application uses a controller like called MainCtrl. This controller's scope will only allow for one $scope.options variable to be defined at a time.
Source Code
I created a github project to demonstrate creating a directive that houses the ng3-chart directives. This can be found at ng3-directives source. I suggest cloning the repo and launch the index.html from your favorite browser. I am currently using Chrome, so I know it works there, however, this example should work in all major browsers.
Sample Directive
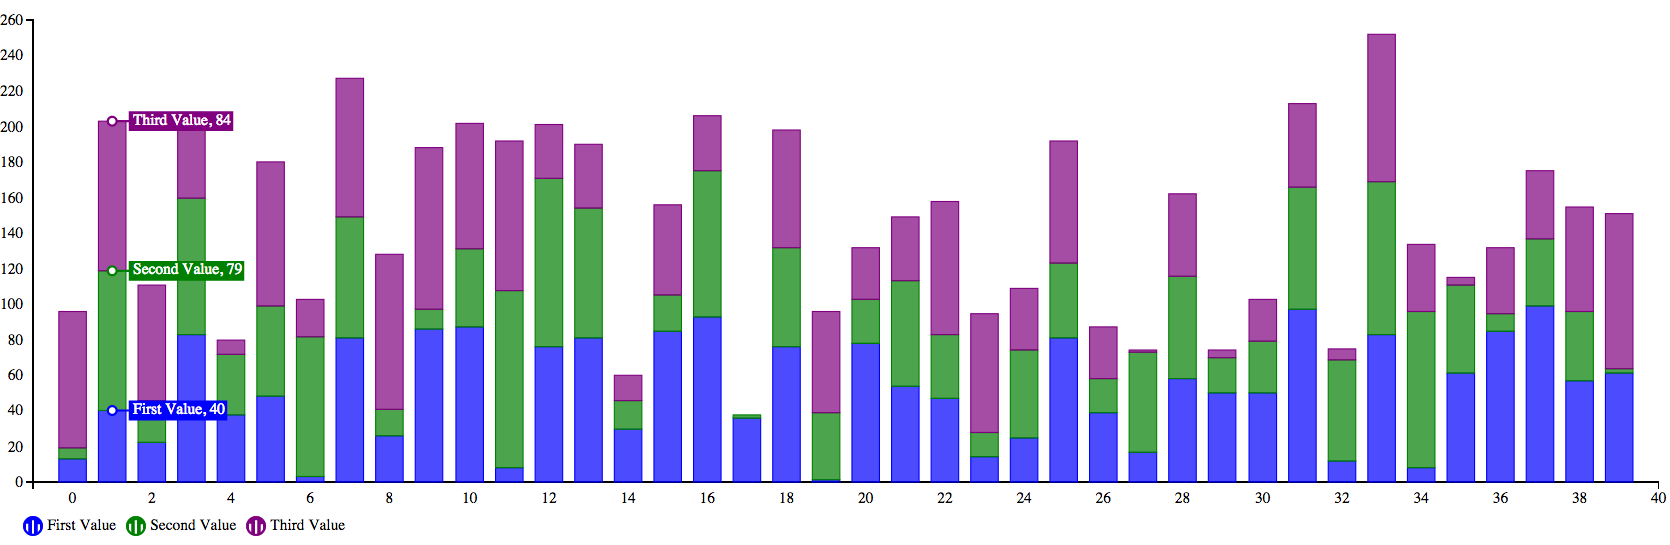
Below is a sample directive I created for making a stacked bar chart.
.directive('barChart', [
function () {
return {
restrict: 'EA',
template: 'Result
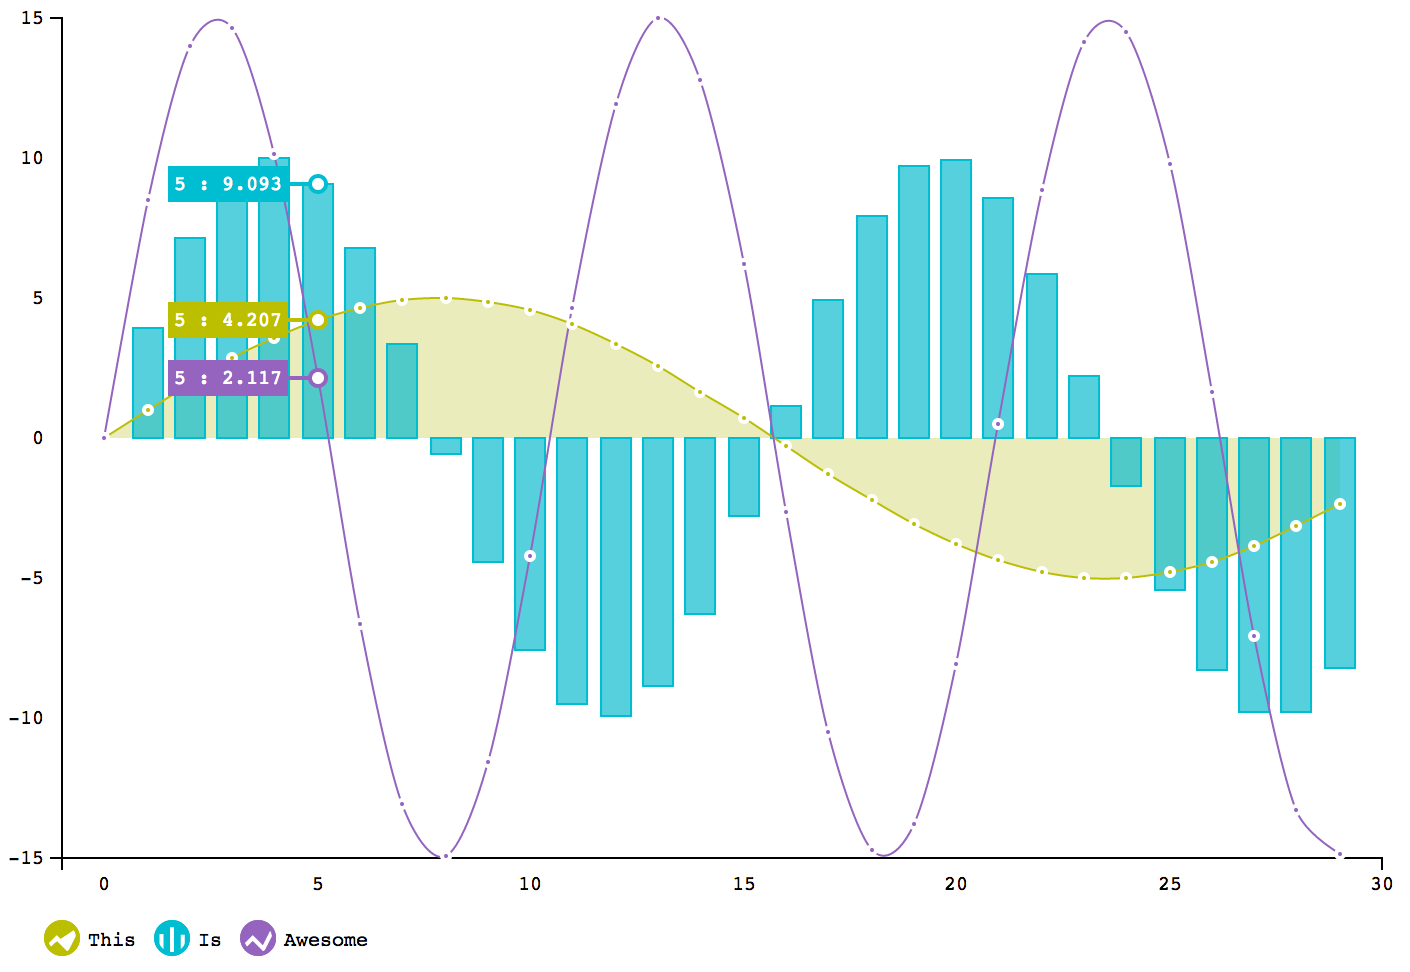
The above options results in the following graph:
The directive is really easy to implement. Basically, I wrap the ng3-charts directive around a new directive, and use the new directive's template property to specify that I want to use ng3-charts linechart directive. For example, my template property on my custom directive is
template: '<linechart data="data" options="options" mode=""></linechart>'
This above directive can be used as either a new element called <bar-chart></bar-chart> or as an attribute like so: <div bar-chart></div>
The Data
To generate the data in the code snippet above, I just generated my dummy data with a for loop then built the required JSON structure which ng3-charts expects when processing it. However, if I have to generate actual data, or if I have to call a web service to get the data, I would create an Angular service using a factory service that Angular provides, as this would allow reuse of the calculations/calls that need to be made to get the data.
Conclusion
In the end, this fit my use case, and I plan on adding some major functionality to it because requirements are pouring in from managment. I like a lot of the functionality that I got out of the box with n3-charts, however, I might create an overhaul that would include testing. I know, testing is key, however, all the tests for n3 were written in coffee script, and I couldnt get them to work on my javascript version of the project. If you could help please stop on by and contribute.